Skip to content

Featured Applications


  1. Funding A Water-Secure Future Data Dashboard

    By Derilinx and the World Bank Group

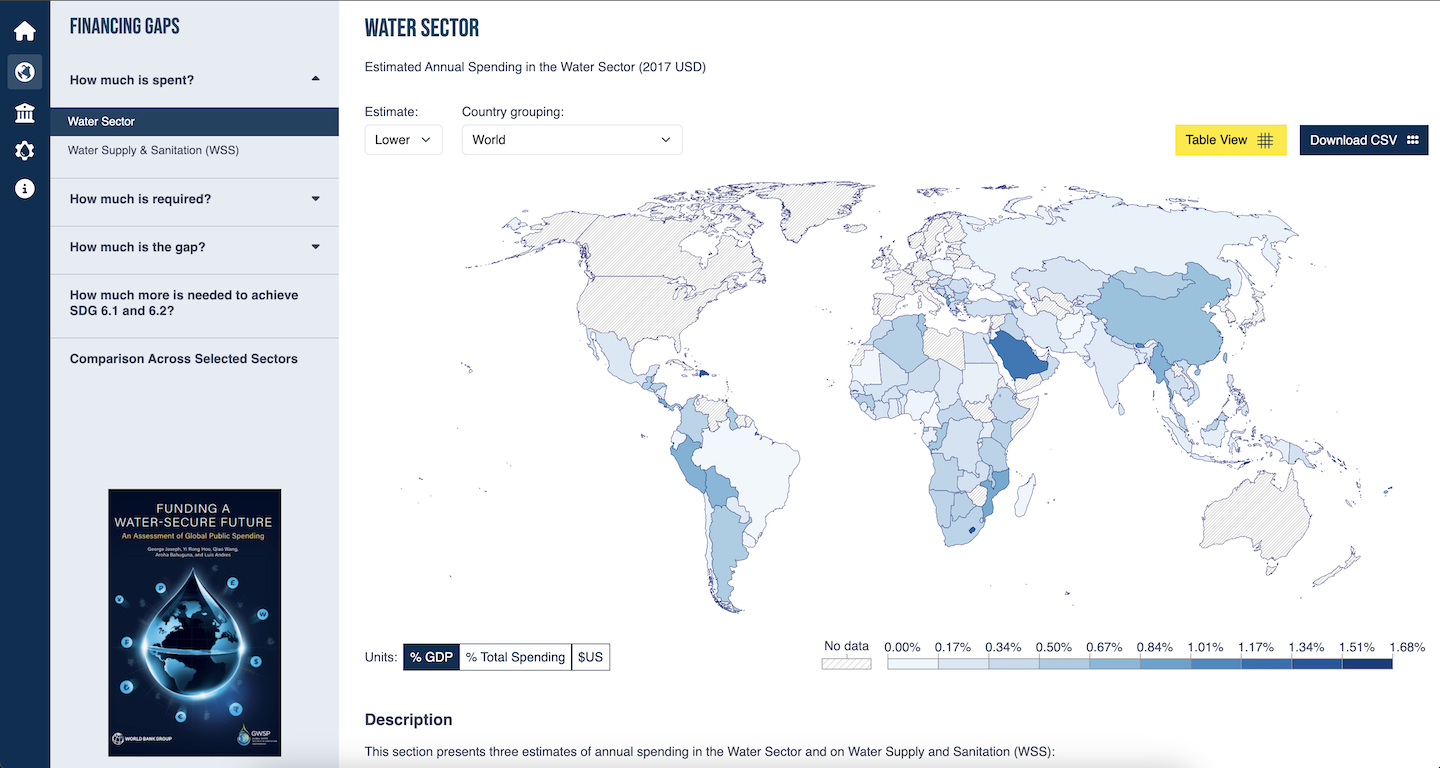
    This dashboard is designed to provide policymakers, development practitioners, and stakeholders with a clear and comprehensive view of global public spending in the water sector and the funding and financing gaps to achieve the sustainable development goals (SDGs) for the sector.

    The dashboard visualizes critical data, including annual spending, spending needs, spending gaps, budget execution rates, and inefficiencies, highlighting where weaknesses are most pressing in the water sector.
  2. ECA Water Security Assessment Toolbox

    By the World Bank Group

    This tool provides a dummy version of applying the water security assessment to a particular country of interest. The assessment is performed on three different categories: Core, Supporting and Informative indicators. These indicators are selected after undergoing a selection process based on relevance, reliability, availability and accessibility. The indicators cover the four main different dimensions of water security: Endowment, Performance, Architecture and Outcomes identified by various water experts.

  3. WPS Global Early Warning Tool

    By the Water, Peace and Security Partnership

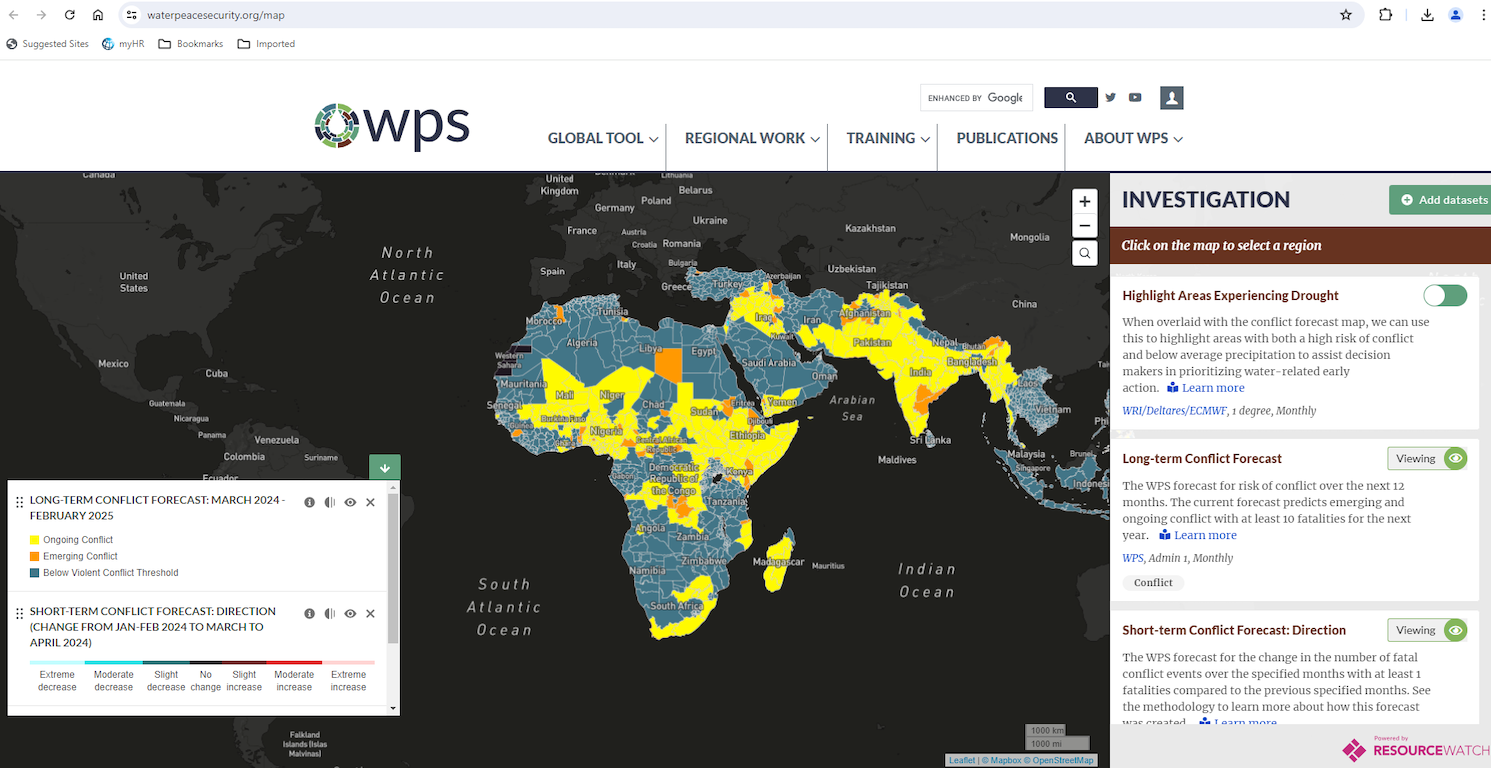
    The Water, Peace, and Security Partnership’s (WPS) Global Early Warning Tool employs machine learning to forecast conflict over the next 12 months in Africa, the Middle East, and South and Southeast Asia. Through cutting-edge technologies such as artificial intelligence, big data, human responses modeling and remote sensing, the Global Early Warning Tool raises awareness of the risks of water-related security threats. WPS is working on regular updates to the platform to improve its model and extend its geographic coverage.

  4. SDG6 Data Portal

    By SDG6

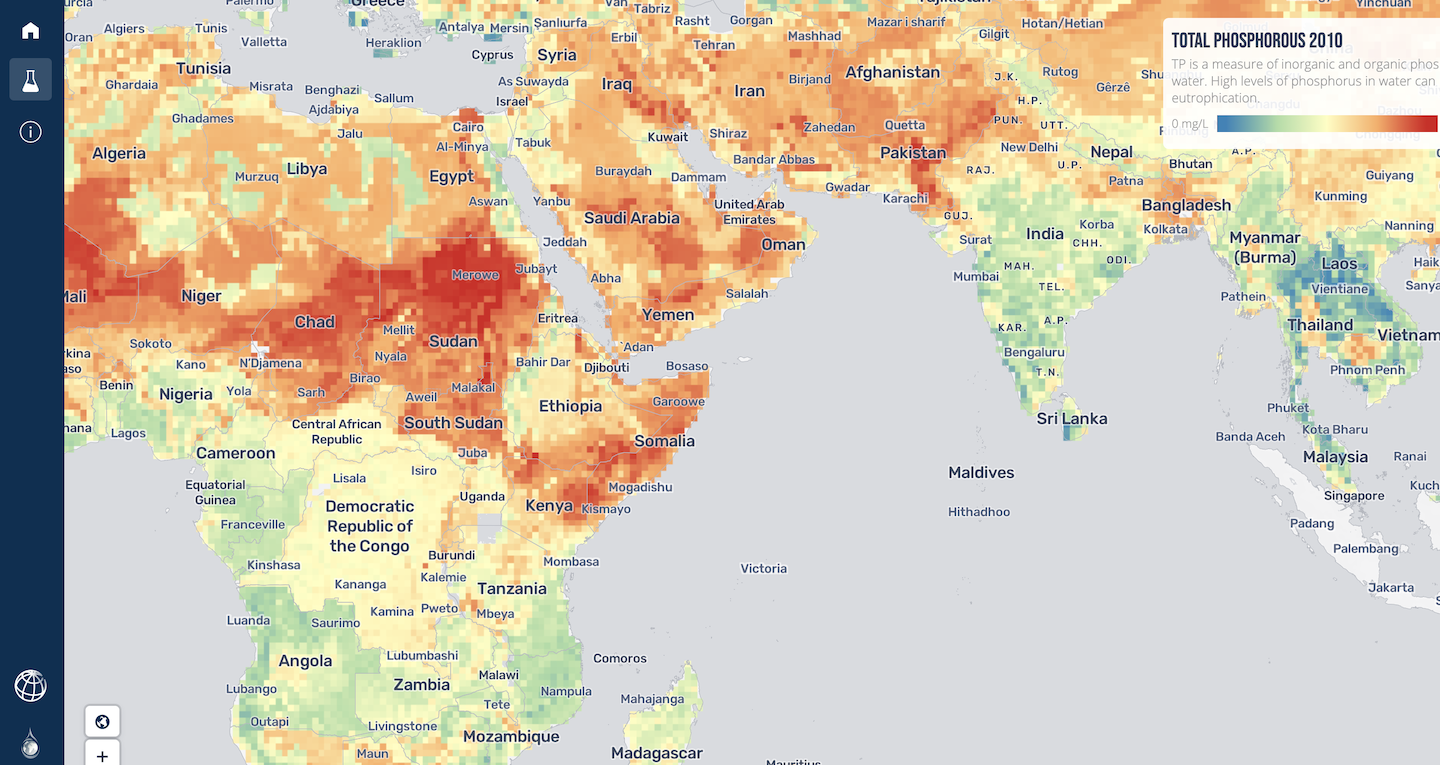
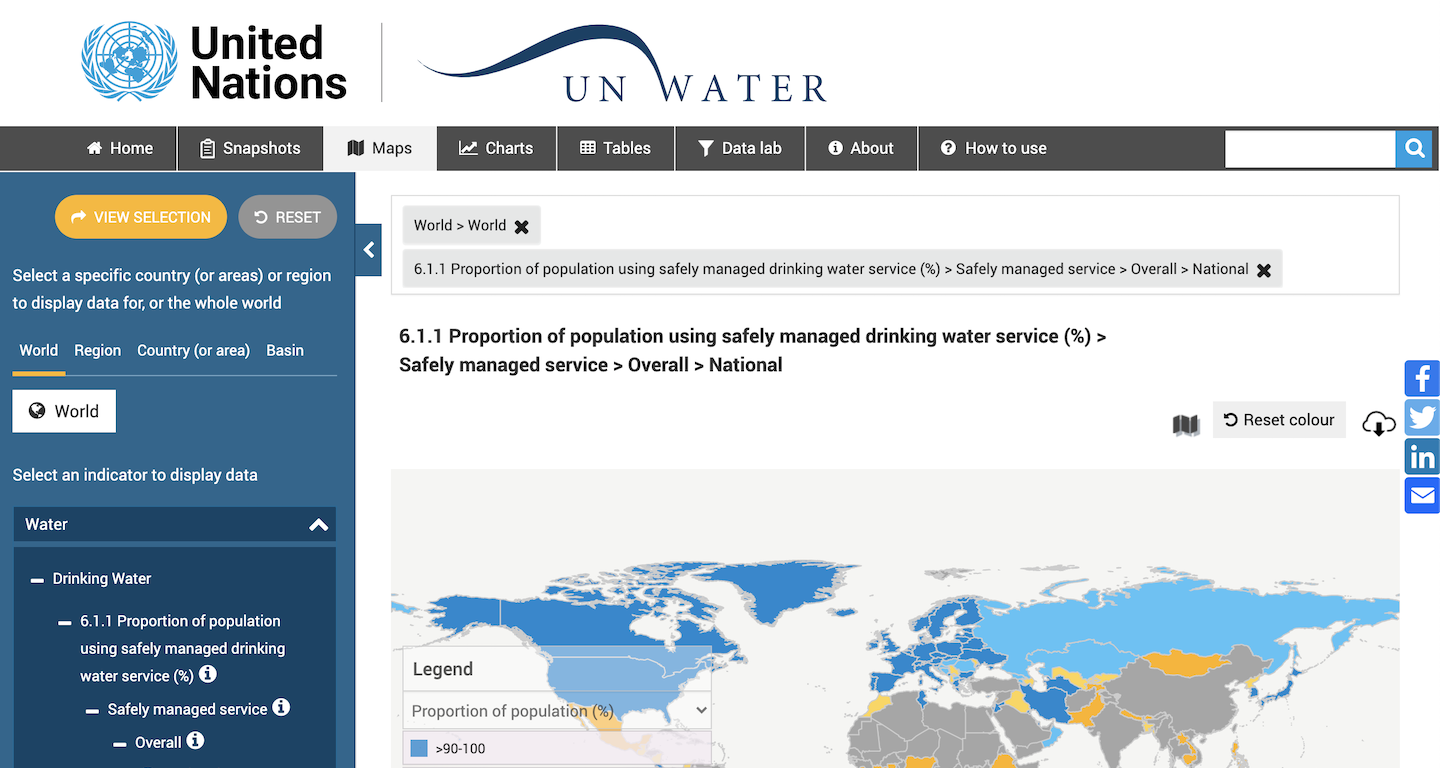
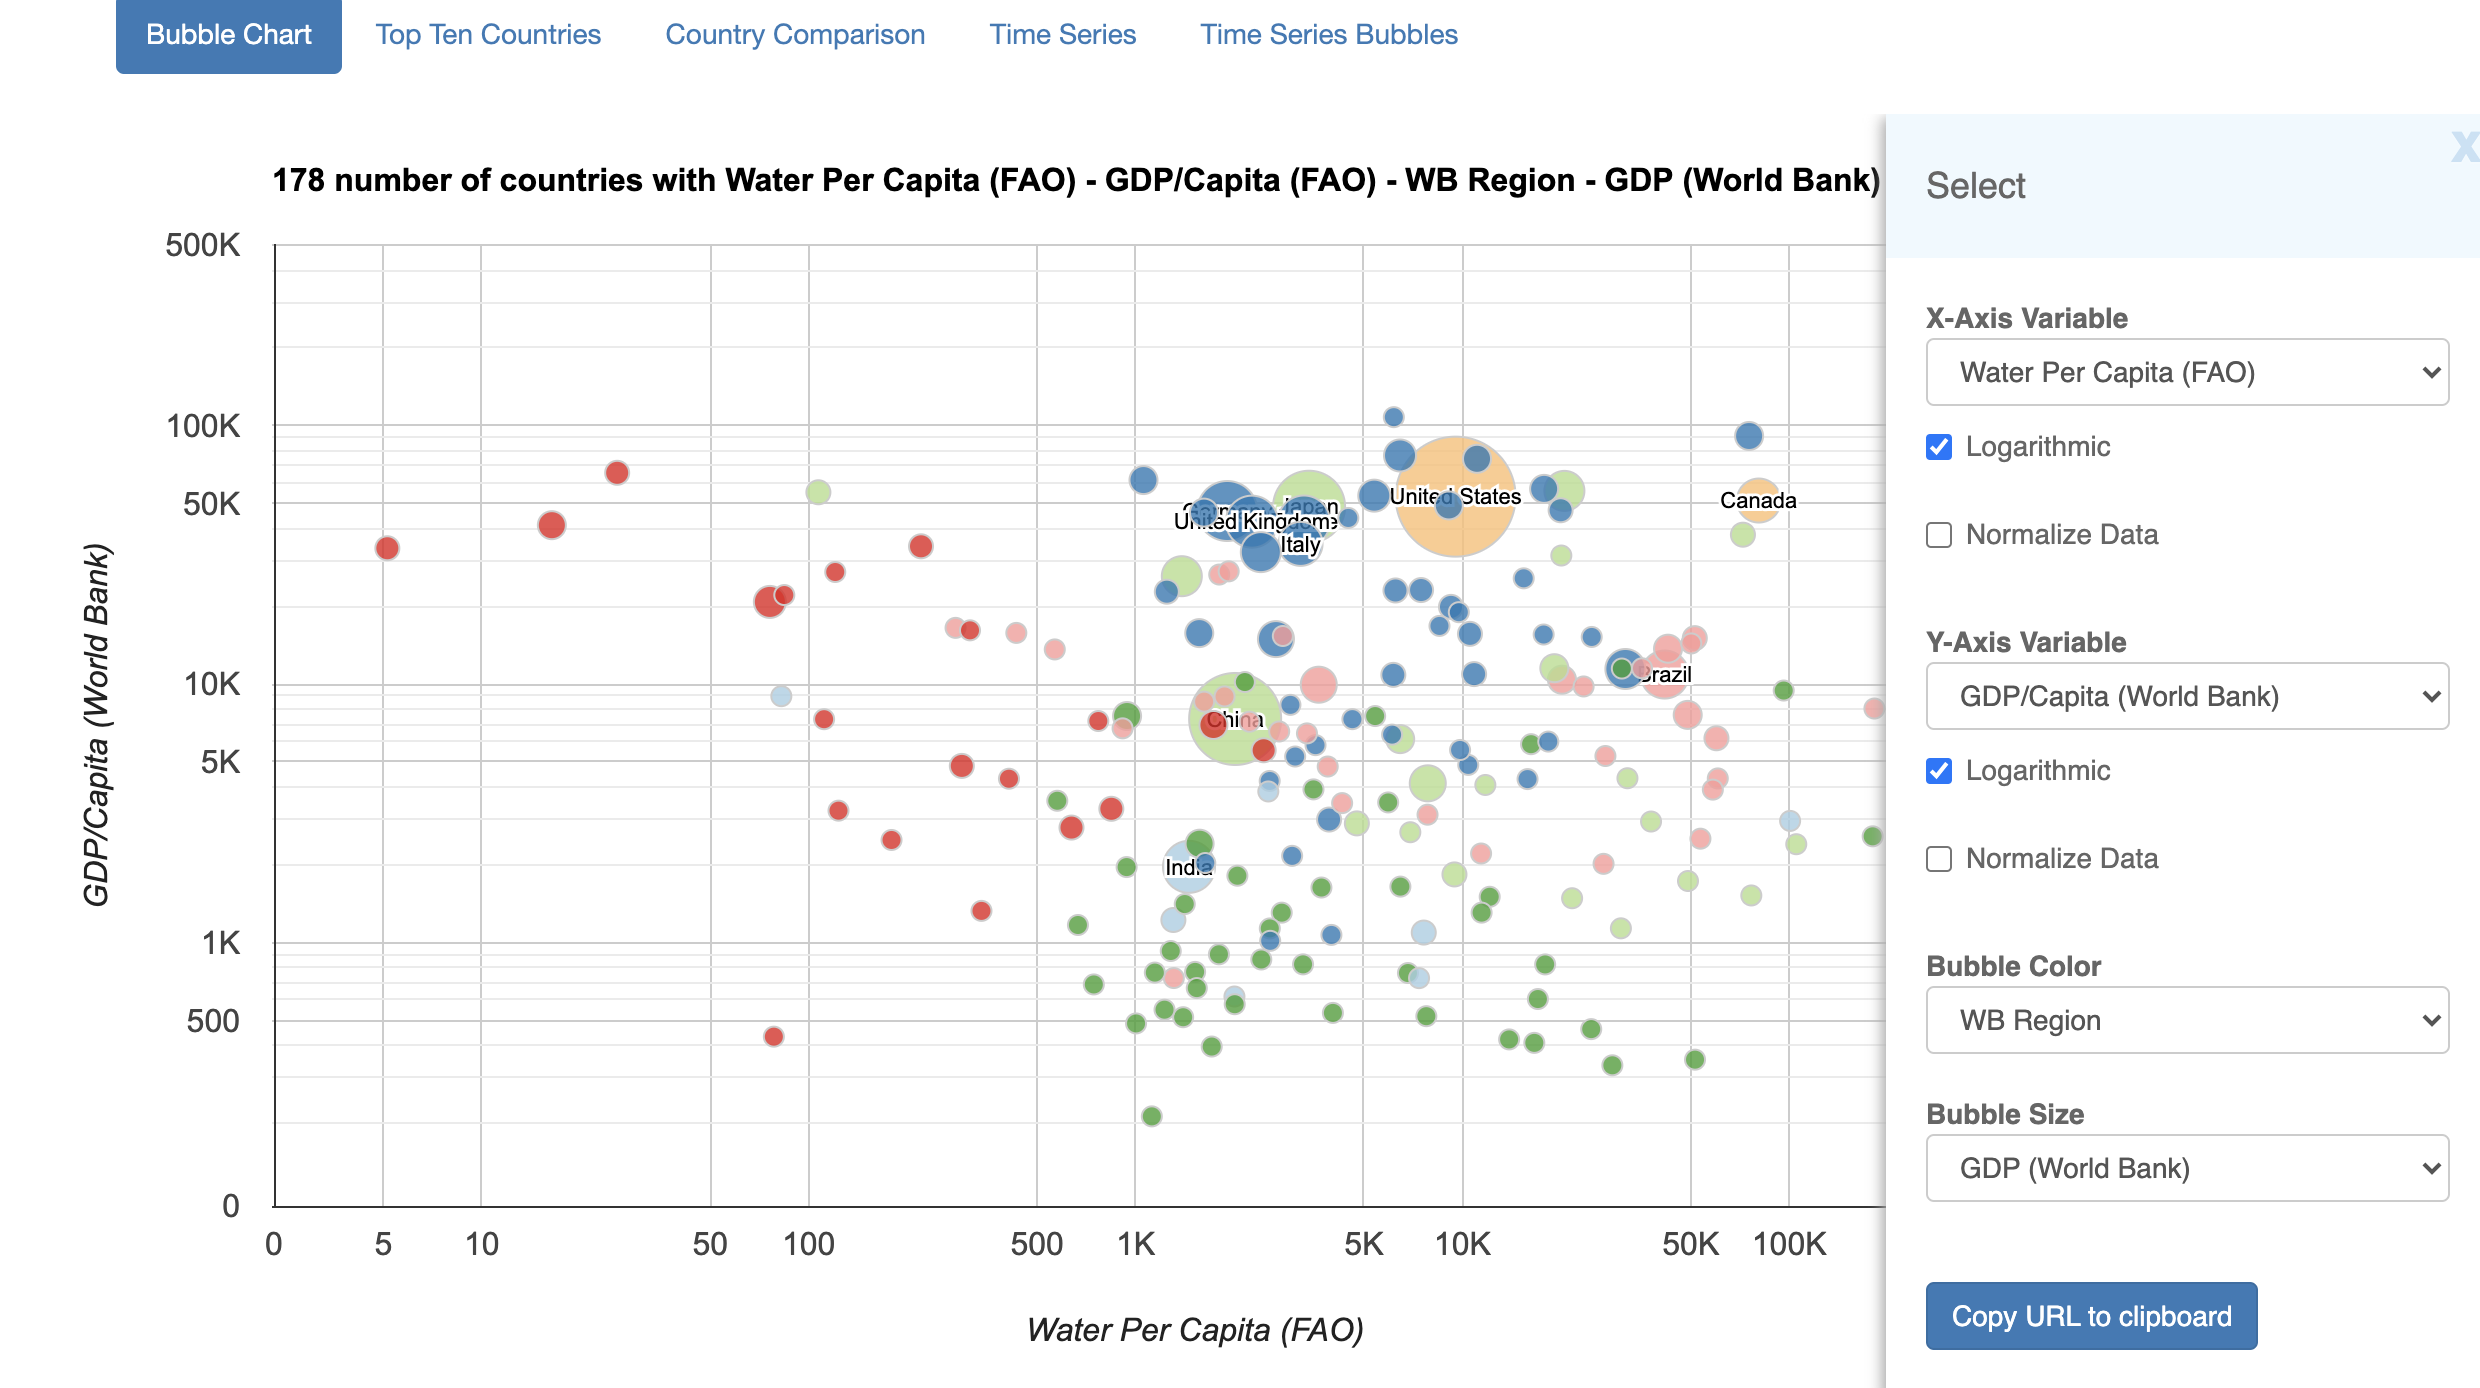
    The SDG 6 Data Portal, one of the flagship products of the Initiative, brings together data on all the SDG 6 global indicators and other key social, economic and environmental parameters. Through maps, charts and tables, the portal offers tailored options for visualization and analysis of the data, including on interlinkages. As such, the portal complements the Global SDG Indicators Database and indicator-specific databases.

Other Applications


  1. BlueTech Interactive eBook

    By the World Bank Group

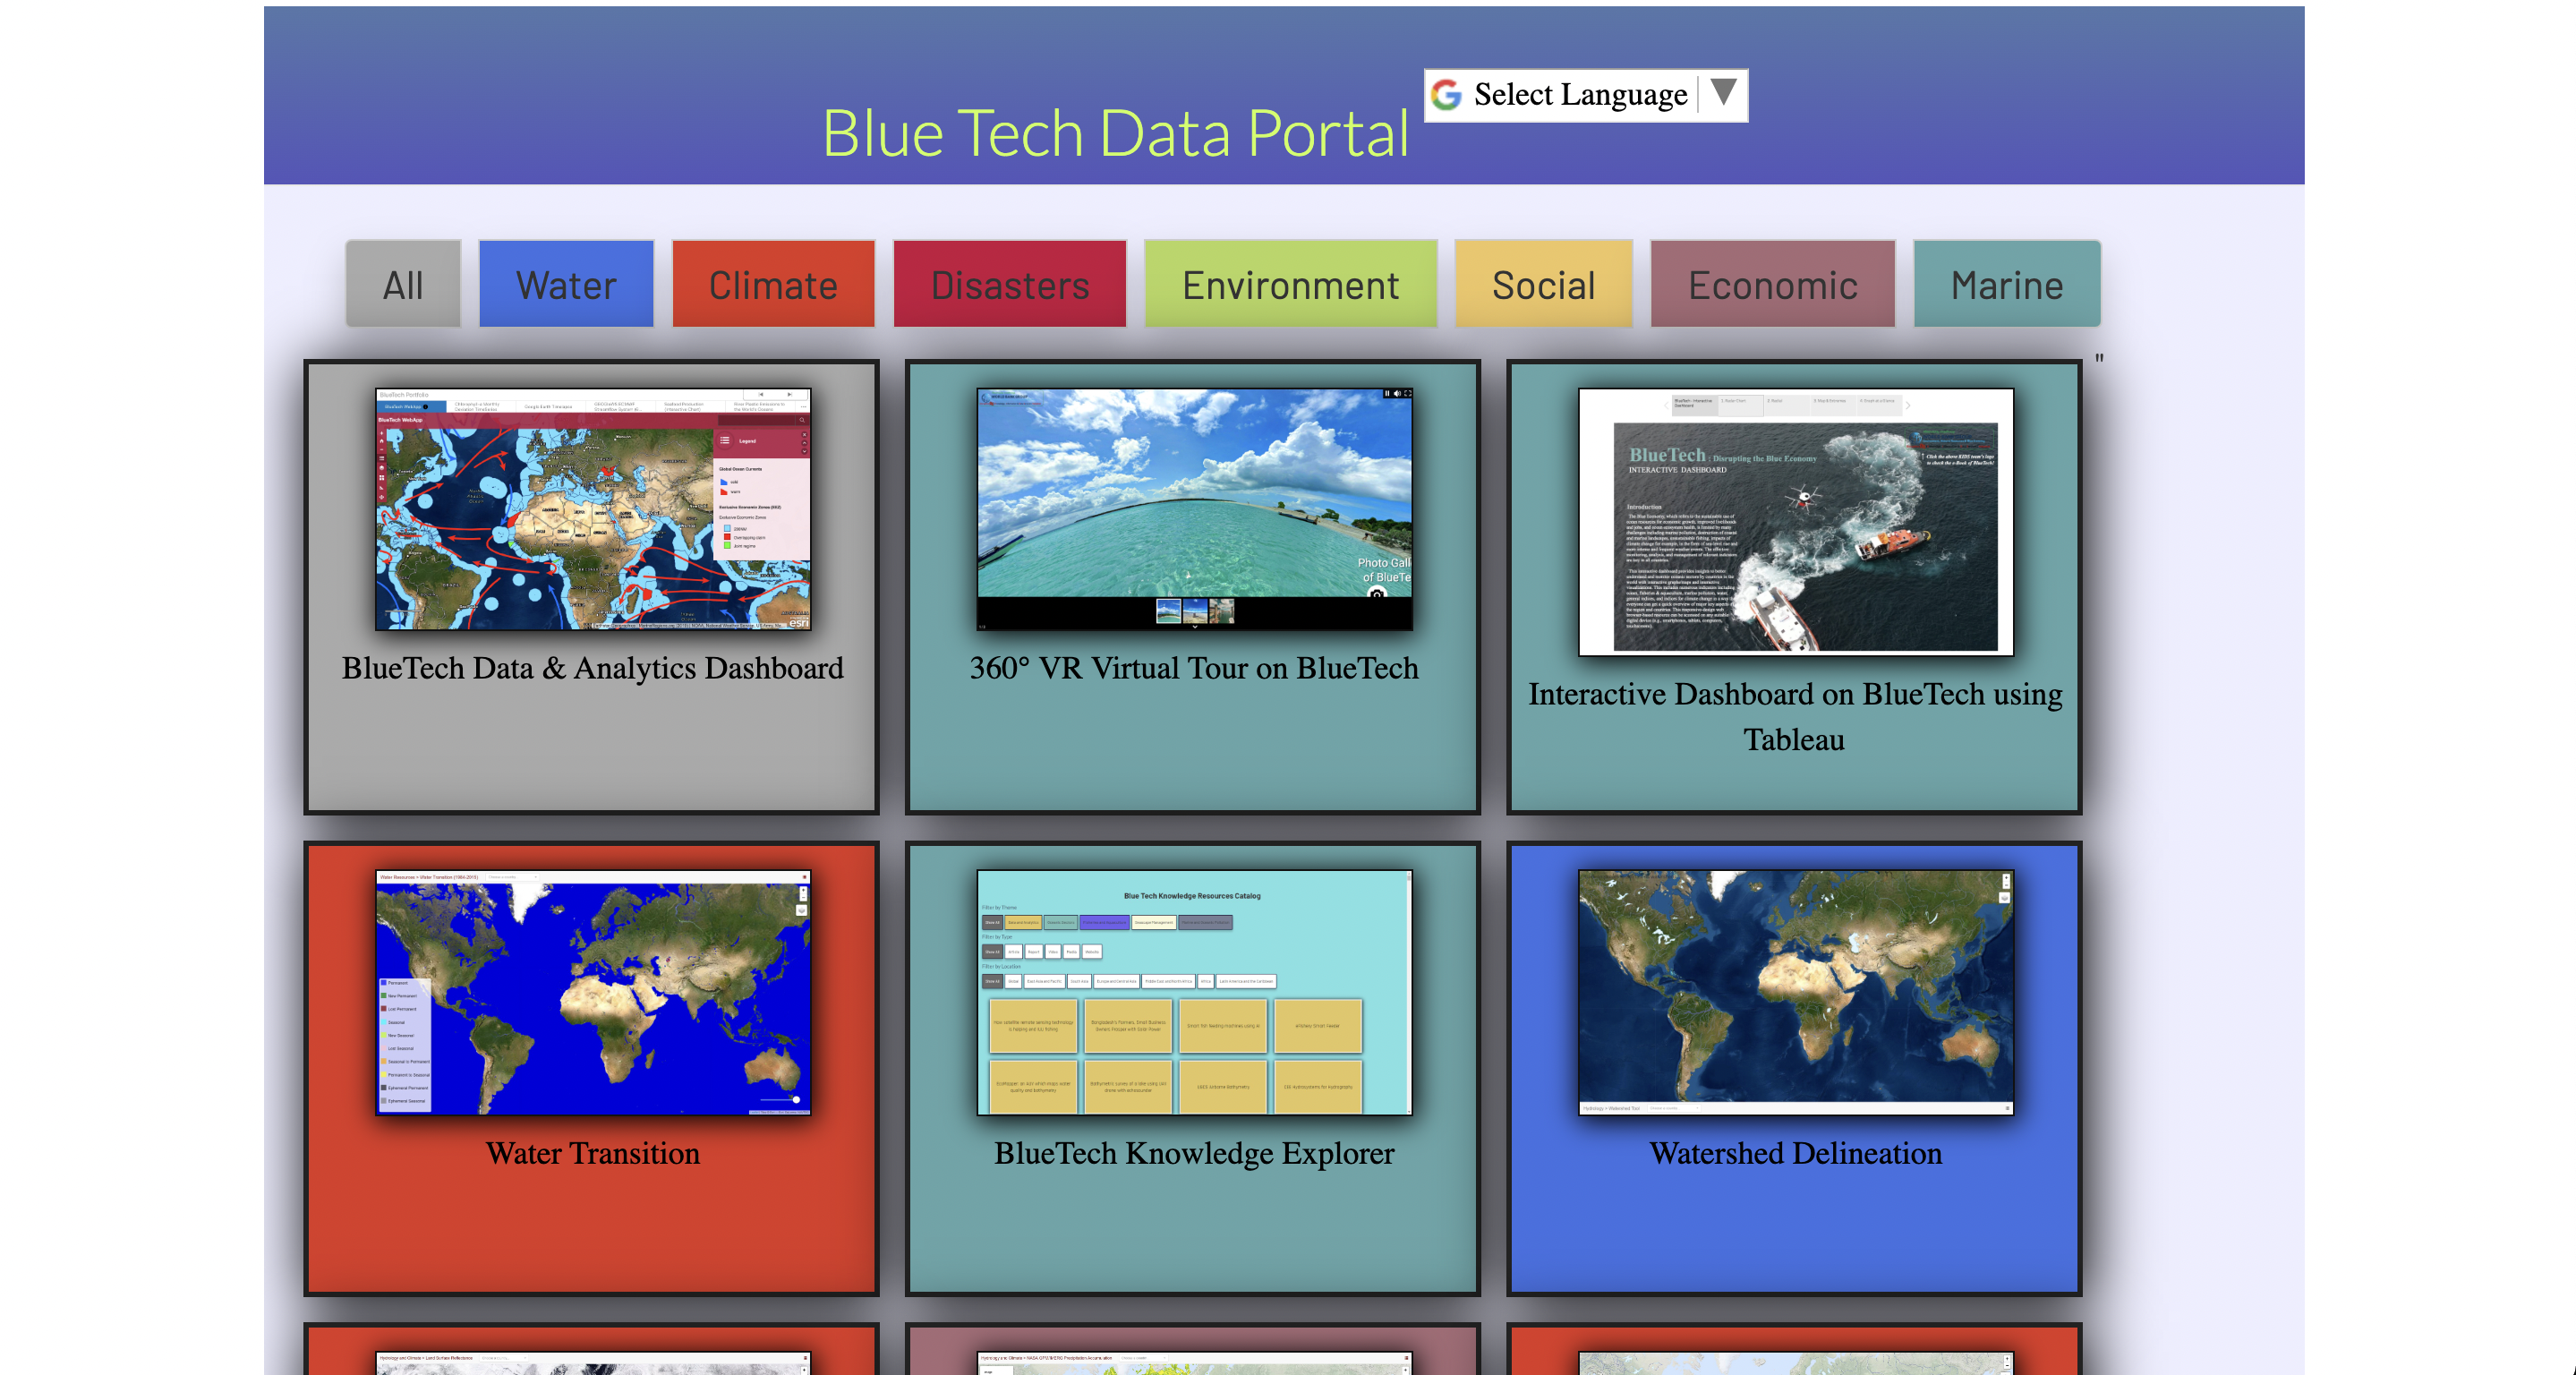
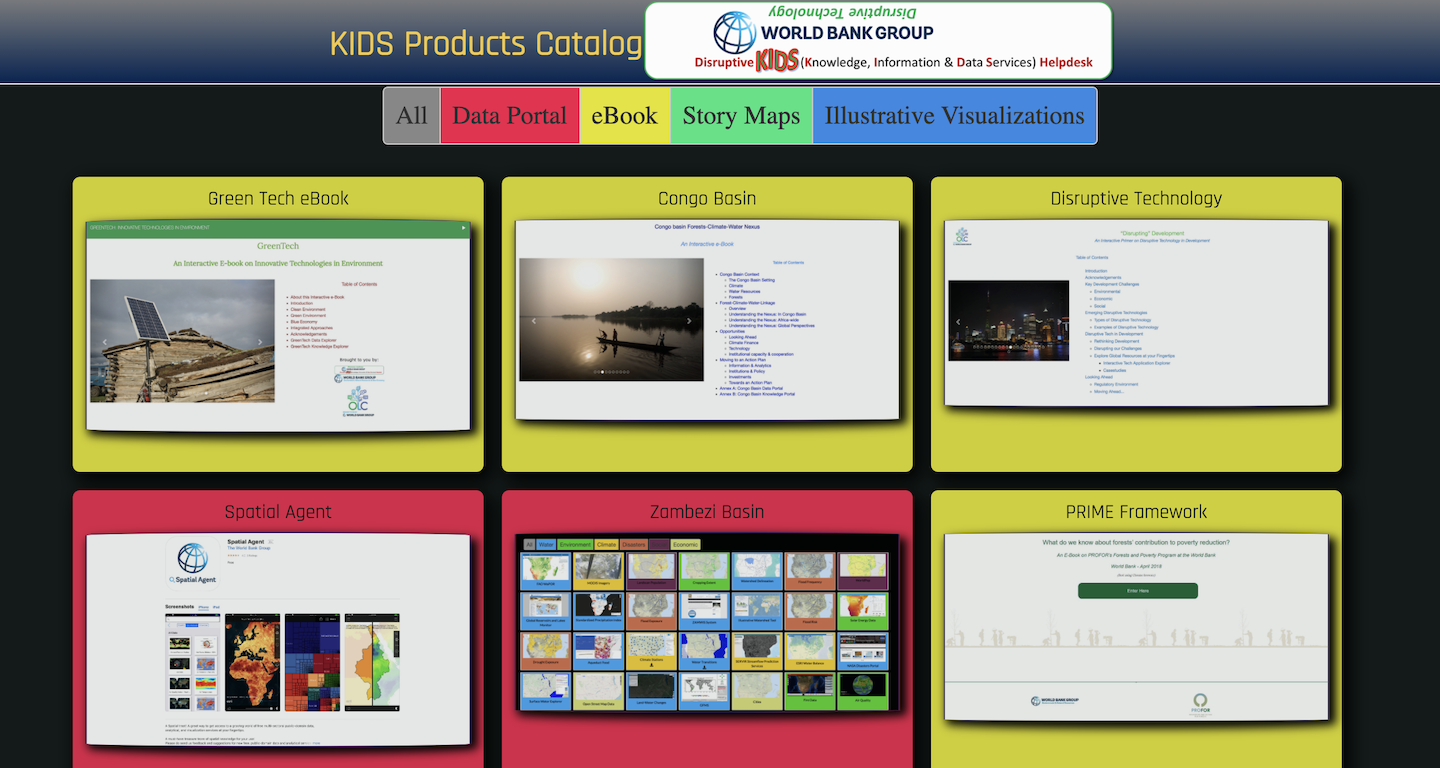
    This innovative interactive e-book is to provide a quick introduction to how Technology and Innovation are being applied in the Blue Economy. An interactive e-book is more than a pdf or static electronic document. This e-book includes text and a wide range of interactive elements (e.g., hyperlinks, photo galleries, video galleries, interactive graphs, interactive maps, interactive data/knowledge filters, etc.) drawing upon multiple online resources.

  2. Aqueduct: Water Risk Atlas

    By WRI

    Aqueduct’s tools map water risks such as floods, droughts, and stress, using open-source, peer reviewed data. Beyond the tools, the Aqueduct team works one-on-one with companies, governments, and research partners to help advance best practices in water resources management and enable sustainable growth in a water-constrained world.